Observer 介绍
arbiter-observer 主要就是用来收集 metrics-server, prometheus 等相关的数据为调度器提供统一资源接入,
为调度器提供数据源。以及后续作为统一监控数据面板,提供数据可视化支持能力。
设计形式
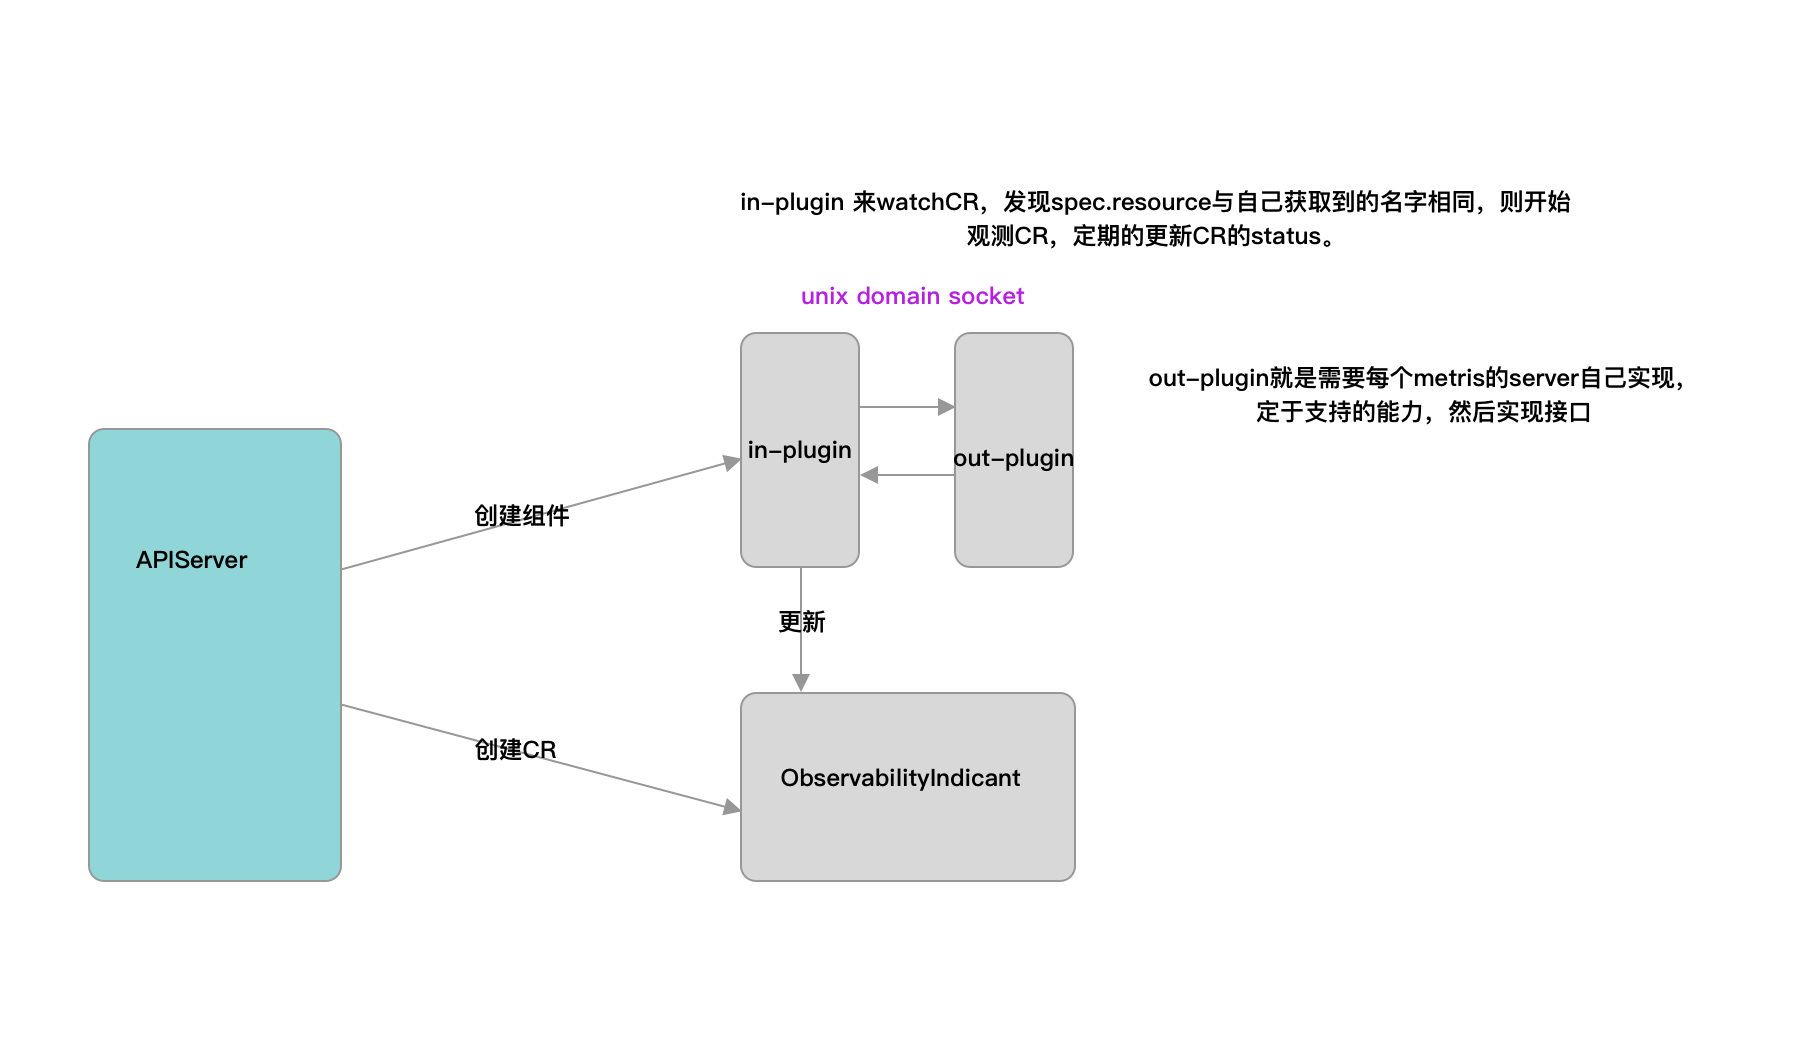
arbiter-observer 主要实现为 operator 的形式。周期性获取监控数据填写到 status 字段中。
数据的获取形式,在第一个版本中支持到 metric-server,prometheus。
metric-server,prometheus 这类的数据源与 arbiter-server 通过 sidecar 方式部署。二者通过 rpc 和 socket 通信。
arbiter-observer 通过资源的名字,或者标签来选择目标资源。目前 ObservabilityIndicant 没有对一组的数据进行处理,
所以在使用标签的时候需要结合 index, 对于通过标签获取到的数据按照名称排序,选择 index。
如果下标超过资源列表长度,不会启动任何获取数据协程。
目前可以在 spec 中设置模板查询语句,例如 PromQL sum(node_memory_MemTotal_bytes{instance="{{.metadata.name}}"} - node_memory_MemAvailable_bytes{instance="{{.metadata.name}}"})。
在执行的时候,会将实际资源的信息填入到查询语句中。
整体架构如图
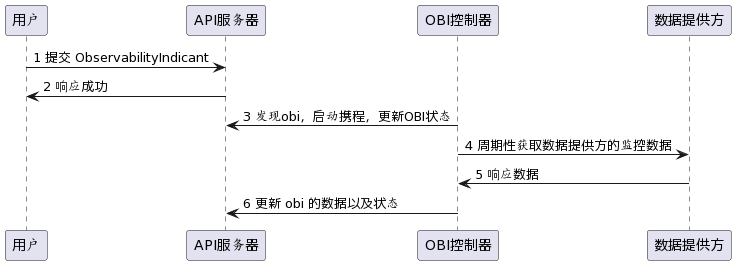
时序图
GRPC 数据定义
service Server {
    rpc GetPluginName (GetPluginNameRequest)
        returns (GetPluginNameResponse) {}

    rpc PluginCapabilities (PluginCapabilitiesRequest)
        returns (PluginCapabilitiesResponse) {}

    rpc GetMetrics (GetMetricsRequest)
        returns (GetMetricsResponse) {}
}
共定义三个接口,GetPluginName 获取数据源的名称,arbiter-observer 通过这个名称与 ObservabilityIndicant 的 spec.source 结合判断,
是否需要处理当前发生的事件。 PluginCapabilitiyes 告诉当前数据源支持哪些聚合逻辑,例如获取最大值,最小值等。
最后一个函数 GetMetrics 就是用来获取监控数据。
CRD 定义
字段含义
- source 字段
source通过与GetPluginName接口获取到的数据对比判断是否需要处理ObservabilityIndicant的变化。
- metric 字段
metric.historyLimit这个字段表示保留多少条周期性获取的数据,例如 historyLimit=3, 在第三次获取数据后,数据为[1, 2, 3], 那么第四次获取数据后保留的数据为[2, 3, 4]。metric.metricIntervalSeconds表示获取数据的周期。metric.timeRangeSeconds表示获取的数据的时间范围,now-timeRangeSeconds, now。
targetRef 字段
targetRef用来确定一个ObservabilityIndicant关联的具体资源,例如 Pod,或者 Node。```yaml
targetRef:
group: ""
index: 1
kind: Node
labels:
beta.kubernetes.io/arch: amd64
name: ""
namespace: ""
version: v1
```
使用 group, kind, version 来确定具体资源的类型以及版本,使用 name 或者 labels+index来确定具体的资源。
获取到资源后,即可利用该资源填充查询语句。