Observer
arbiter-observer is mainly used to collect metrics-server, prometheus and other related data to provide unified resource access for the scheduler.
Provides a data source for the scheduler. And follow-up as a unified monitoring data panel to provide data visualization support capabilities.
Design
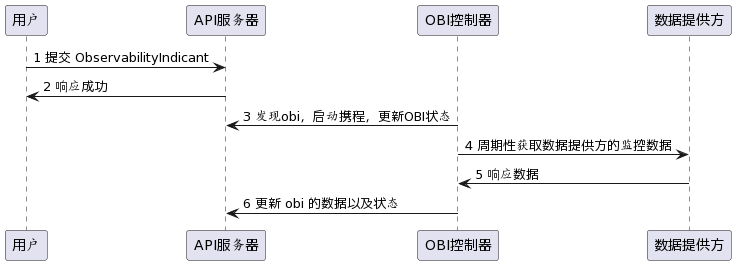
arbiter-observer is mainly implemented in the form of operator. Periodically obtain monitoring data and fill in the status field.
The data acquisition form supports metric-server and prometheus in the first version.
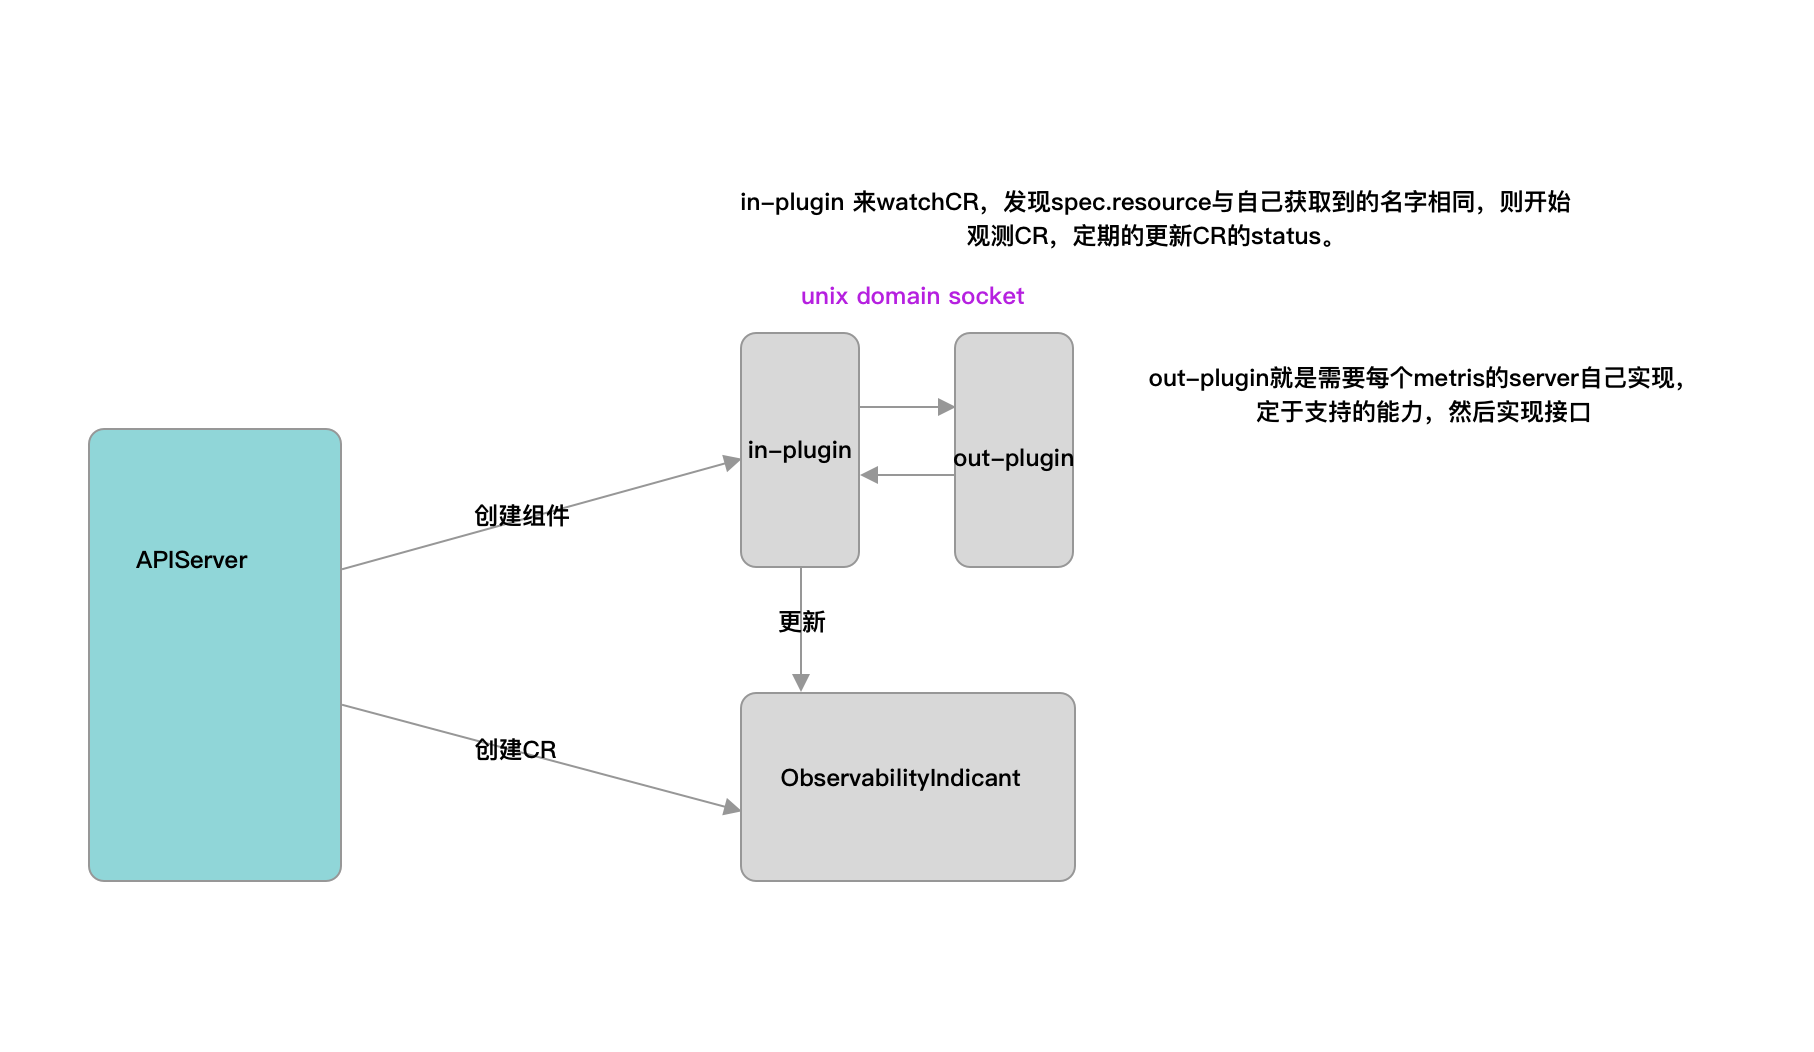
Data sources such as metric-server and prometheus are deployed with arbiter-server through sidecar. The two communicate via rpc and socket.
arbiter-observer selects target resources by resource name, or labels. At present, ObservabilityIndicant does not process a group of data, so you need to combine the index when using the labels. For the data obtained through the labels, sort the data by name, and select index. If the subscript exceeds the length of the resource list, no data acquisition coroutine will be started.
Currently you can set template query statements in spec, such as PromQL sum(node_memory_MemTotal_bytes{instance="{{.metadata.name}}"} - node_memory_MemAvailable_bytes{instance="{{.metadata.name}}"}). When executed, the information of the actual resource will be filled into the query statement.
Architecture diagram
Timing diagram
GRPC Data Format Definition
service Server {
    rpc GetPluginName (GetPluginNameRequest)
        returns (GetPluginNameResponse) {}

    rpc PluginCapabilities (PluginCapabilitiesRequest)
        returns (PluginCapabilitiesResponse) {}

    rpc GetMetrics (GetMetricsRequest)
        returns (GetMetricsResponse) {}
}
There are three interfaces are defined, GetPluginName gets the name of the data source, arbiter-observer judges by combining this name with spec.source of ObservabilityIndicant,
Whether the currently occurring event needs to be handled. PluginCapabilitiyes tells what aggregation logic is supported by the current data source, such as getting max, min, etc.
The last function GetMetrics is used to get monitoring data.
CRD Definition
Field meaning
source field
sourcejudges whether the change ofObservabilityIndicantneeds to be processed by comparing it with the data obtained by theGetPluginNameinterface.metric field
metric.historyLimitThis field indicates how many pieces of periodically acquired data are retained, such as historyLimit=3, after the third acquisition of data, the data is[1, 2, 3], Then the data retained after the fourth acquisition is[2, 3, 4]. Currently this field is fixed to 1metric.metricIntervalSecondsrepresents the interval for fetching data.metric.timeRangeSecondsrepresents the time range of the acquired data,now-timeRangeSeconds, now.targetRef 字段
targetRefis used to identify a specific resource associated with anObservabilityIndicant, such as a Pod, or a Node.```yaml
targetRef:
group: ""
index: 1
kind: Node
labels:
beta.kubernetes.io/arch: amd64
name: ""
namespace: ""
version: v1
```
Use group, kind, version to determine the type and version of a specific resource, and use name or labels+index to determine a specific resource.
After the resource is obtained, the query statement can be filled with the resource.